How to Read a Baby Growth Chart During Your Child’s First 24 Months
Children come in all shapes and sizes, and all babies grow at their own pace. At your child’s regular health checkups, your little one’s healthcare provider will plot certain measurements on a baby growth chart to make sure they’re on the right track. The chart might look daunting, but your provider can help you understand this useful tool and what the results mean for your child. To make it easier, we'll show you how to read a baby growth chart and interpret the results.
What Are Baby Growth Charts?
Baby growth charts are important tools healthcare providers use to check your little one’s overall health. The charts assess how your baby is growing compared with other children of the same age and sex, and to see how your child is developing over time. Growth standards used for babies under 24 months old are based on the following:
Weight-for-age. This measurement tracks your baby’s weight at a particular age.
Length-for-age. This measures your baby’s length (height) at a particular age.
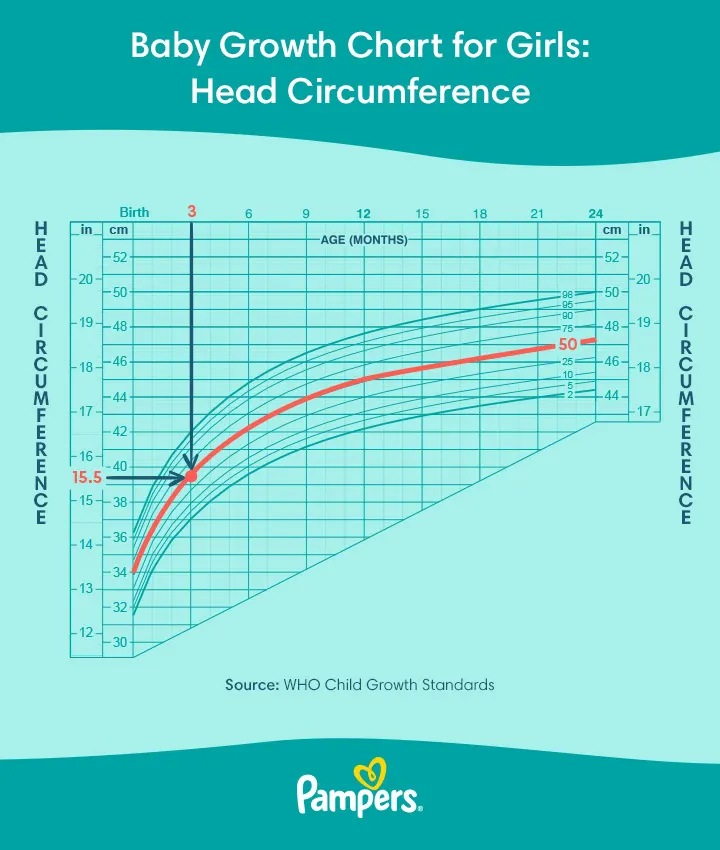
Head circumference. This is the distance around the largest part of the head and indicates how your baby’s brain is growing.
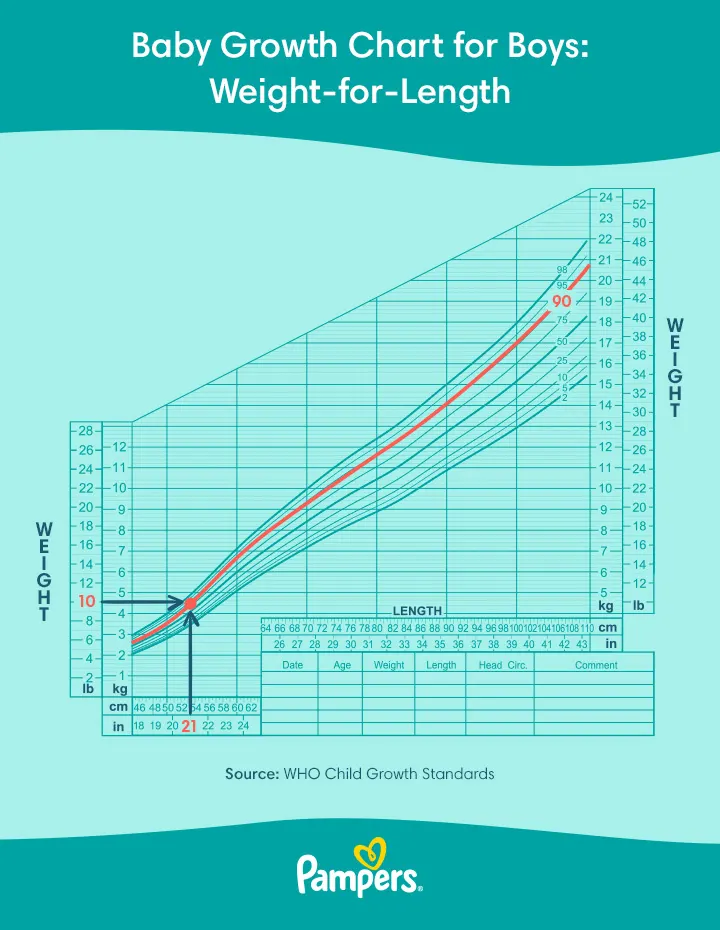
Weight-for-length. This measures your baby’s weight along with their length (height).
Your child’s healthcare provider will use different growth charts for different sexes, using the terms boys and girls, and different charts for babies younger than 24 months and for those 2 years and older. There are also separate charts for infants who are born prematurely and for children with Down Syndrome.
It's helpful to know that these charts offer information that your provider can assess in the context of other baby developmental milestones and genetic factors. You can find and download the charts below.
Baby Boys Growth Chart: Birth to 24 Months
Baby Girls Growth Chart: Birth to 24 Months
When and How Is Your Baby Measured?
You probably chose your child’s healthcare provider while pregnant, and your baby’s initial office visit will be within a few days of their birth or shortly after you leave the hospital. Starting with this first appointment, checking your baby’s growth will become a routine part of each visit, whether your little one is 1 month or 1 year. Initially, your baby's checkups will take place every few weeks, and then every few months until your baby turns 1. Your provider will let you know if you need to visit more often and when to schedule future appointments. Don’t hesitate to ask any questions you might have about your baby’s health and development—your child’s healthcare provider is your partner and can reassure you that you’re doing a great job and help you resolve any issues that pop up! Here’s how babies are usually weighed and measured:
Weight: With your little one undressed, your child’s provider will likely use a baby scale to get the most accurate reading.
Length: Measuring the length (a.k.a. height) of a wriggly baby may be tricky, but your provider is an expert at this! As your little one lies on a flat table, the provider will gently stretch out your baby’s legs to get an accurate measurement from the top of their head to the soles of their feet.
Head circumference: The healthcare provider will wrap a soft tape measure around the widest part of your baby’s head, from above the eyebrows, passing above the ears, to the back of the head.
You might be wondering what else to expect at some of your baby’s regular health checkups. The following links will help you prepare for each individual visit, from month 1 to year 2, and provide information about upcoming immunizations:
You can also use our baby growth chart tool to help you better understand your little one’s development!
How to Read a Baby Growth Chart
Once you have your measurements, you might look at a baby growth chart and wonder how you're supposed to make sense of it. Your baby’s healthcare provider can help you understand your child’s results and plot them on the chart at the health checkup, but in the meantime here’s a quick guide on how to read these charts. Remember, it’s important to use the baby boy growth charts if you have a boy and the baby girl growth charts if you have a girl.
Weight-for-Age Percentile
Although these charts look like something only Einstein could figure out, they’re actually fairly simple to read once you get the hang of it. Using the following steps, track your little one’s percentile for weight:
Find your baby’s weight (pounds or kilograms) on the right side of the grid.
Find your child’s age in months at the top of the chart.
Follow these horizontal and vertical lines until they intersect on the curved line.
Follow that curved line until the end, where the percentiles are written on a white, shaded background.
Length-for-Age Percentile
To determine your baby’s length-for-age (height) percentile on the growth chart, follow the steps below:
Find your baby’s length (in inches or centimeters) on the left side of the grid.
Find your child’s age in months at the bottom of the chart.
Track these horizontal and vertical lines until they intersect on the growth curve.
Follow that curve until the end, where the percentiles are written on a white, shaded background.
Head Circumference Percentile
Finally, to find your baby’s head circumference percentile in the growth chart, follow these steps:
Find your baby’s age in months at the top of the chart. Only some months are numbered, but each month is represented by a vertical line.
Find your baby’s head circumference measurement on the left side (measurements are provided in both inches and centimeters).
Follow these horizontal and vertical lines until they intersect. In most cases, they will intersect on a curved line.
Follow the curved line to the right until it ends, and here you’ll see a number. This number indicates your baby’s head circumference percentile on the growth chart.

Weight-for-Length Percentile
Follow the steps below to find your baby's weight-for-length percentile:
Find your child’s weight (in pounds or kilograms) on the left side of the grid.
Follow the horizontal and vertical lines of these two measurements until they intersect on the growth curve.
Follow the curved line until the end to find your baby’s weight-for-length percentile on the growth chart.

How to Interpret Baby Growth Chart Percentiles
Your child’s healthcare provider is the best person to explain these results to you. Remember, the charts show the typical growth patterns for baby boys and girls, and there is a wide range of healthy results. There’s no ideal result when viewed individually, but, ideally, your child would follow along the same growth pattern (the curved line) over time. As a result, their height and weight would grow in proportion to one another, whether that’s 10th percentile or 90th percentile.
What Are the Percentiles?
The baby growth chart shows which percentile your child is in compared with others of the same age and gender. Percentiles are shown as curved lines. Here’s another example and explanation:
If your child is in the 70th percentile (out of 100) for length-for-age, this means two things:
Seventy percent of babies the same age and sex are shorter than your baby.
The remaining percentage (30 percent) of babies the same age and gender are longer than your baby.
But, this one point doesn't show the complete picture. Your child’s provider will assess several values over time to determine the trend of how your baby is growing compared to the average growth curve on the chart. Try not to become too focused on a single number. There is a wide range of healthy sizes and lengths, and many factors influence your child’s growth, including genetics, environmental factors, nutrition, activity levels, and health conditions. Another thing to consider is when babies have growth spurts, which can vary from child to child. For example, breastfed and formula-fed babies grow in slightly different patterns. Breastfed babies typically put on weight more slowly than formula-fed babies, and formula-fed infants typically go through a growth spurt and gain weight more quickly after 3 months of age.
With all these different factors at play, it’s important to assess these percentiles over time and with your child’s provider.
What Happens if My Baby’s Growth Pattern Changes?
A different growth pattern doesn’t always indicate a problem. Your child may simply be experiencing a growth spurt, which is partly why it’s so important to look at these percentiles over time. However, your child’s healthcare provider will also investigate a growth pattern change to rule out any issues. Typically, a healthy, well-nourished baby grows at a fairly predictable rate. Any change in this rate can help your baby’s provider detect and address feeding, developmental, or medical issues.
What Happens if My Baby Is Above or Below the Average?
Most children fall between the 3rd and 97th percentiles on baby growth charts for head circumference, weight, and length (height). But if your child does not, know that there are many factors at play, and that your child’s provider will consider other developmental milestones and family genetics. Baby growth chart percentiles aren’t like an algebra exam. Just because your little one is in the 50th percentile doesn’t mean there’s a problem! In fact, that figure means your baby is right in the middle of the average. What’s more important is how your child grows over time. Plus, some families might have fast-growing babies, while others have slow and steady gainers. Regardless of what you see on your baby’s growth chart, try not to worry, and keep these individual differences in mind as you follow your child's development. If the healthcare provider determines that your baby is overweight, underweight, growing too fast, or growing too slowly, trust that your little one is in good care, and follow the provider’s recommendations.
The Bottom Line
Baby growth charts, whether for boys or girls, can be confusing at first glance. In the end, it’s always best to look at your baby’s growth chart percentiles together with their healthcare provider over time, and to avoid comparing your child to others.
Instead, focus on all the growing your little one is doing! And, if your baby’s healthcare provider says they’re on the right track, you can take pride in your child’s progress regardless of the value on the chart. In fact, you’ll probably be delighted (and maybe even a little surprised) when you see how big your baby is now compared to the day they were born. Your little one is a moving, grooving, and growing machine, and there’s so much to look forward to, such as watching them start to crawl and walk, hearing those first laughs, and helping them develop those fine motor skills. As your baby hits milestone after milestone, reward yourself for all your hard work with our Pampers Club App.
How we wrote this article The information in this article is based on the expert advice found in trusted medical and government sources, such as the American Academy of Pediatrics and the American College of Obstetricians and Gynecologists. You can find a full list of sources used for this article below. The content on this page should not replace professional medical advice. Always consult medical professionals for full diagnosis and treatment.
Join a World of Support
through Pregnancy and Parenthood.
TRACK WITH TOOLS
LEARN WITH EXPERTS
GET REWARDED


